Before presenting GHG emission figures, it's important to emphasize that tracking these emissions to absolute decimals is a complex task.
Nonetheless, we now live in a world where several credible sources of historical emissions have been developed.
Some of the most popular emission data sources are those provided by ‘Climate Watch’, ‘PIK PRIMAP-hist’, ‘UNFCCC’ and ‘GCP’.
While the scope & methodology used to track GHG emissions can slightly vary between them; there all unanimously, point to the same trend of exponentially rising GHG emissions.
Depending on what you are using the data for, there are certain advantages and disadvantages to each source.
Since our core interest is to present to you the whole climate story as is, we decided to use PIK PRIMAP-hist data source which has data going all the way back to 1850. It uses countries’ official inventories reported to the UNFCCC as a basis, and fills in with data-gaps (in the UNFCCC data source) from other sources.
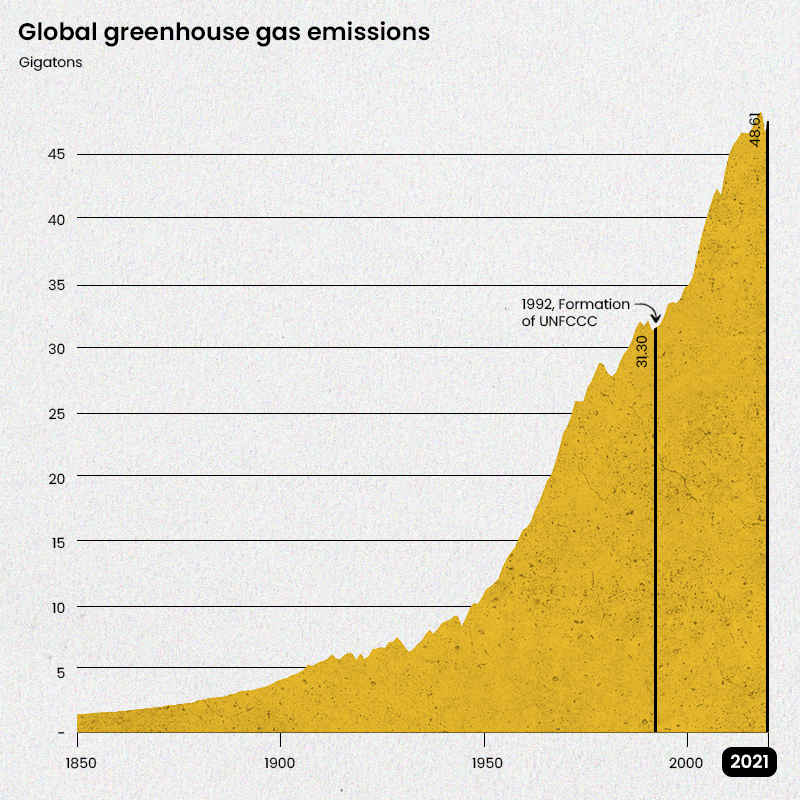
In 1850, when we were just beginning to transition into an industrialised world-order, our annual greenhouse gas emissions was 1.46 giga-tonnes [ ie ~ 1,460,000,000,000 kg].
By 1992, when the UNFCCC was formed to tackle climate change, our greenhouse gases emissions had shot to 31.30 giga-tonnes. This was a more than a 20x increase in just 142 years.
If this was not alarming enough, what's more interesting to note is that, despite all efforts & global negotiations since the UNFCCC, our absolute greenhouse gases emissions have continued to increase (with the exception of the Covid-19 year ).
In 2021, we released 48.61 giga-tonnes of greenhouse gases into our atmosphere. This was 33 times higher than in 1850 !
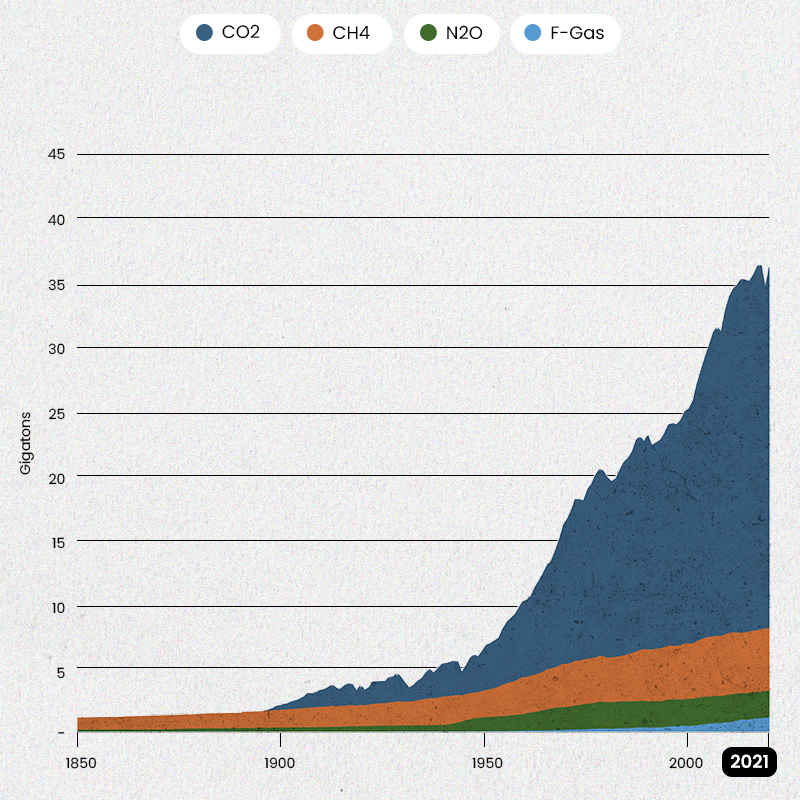
[Our annual emissions of carbon dioxide, methane and nitrous oxide has increased by 17500+%, 600+% and 2000+%, respectively between 1850 and 2021.]
Carbon Dioxide (CO2) is the largest emitted greenhouses gases. It has dominated the greenhouse gas emission pool since 1850.
In 2021, carbon dioxide emission alone accounted for 74.5% of total GHG emissions.
This was followed by methane (16.5%), nitrous oxide (6.5%) & F-Gas (2.5%).
Because of this nature of disproportionately high emissions of carbon dioxide each year (compared to the other greenhouse gases) it has come to dominate the language of climate change and action, despite having a low 'global warming potential'.
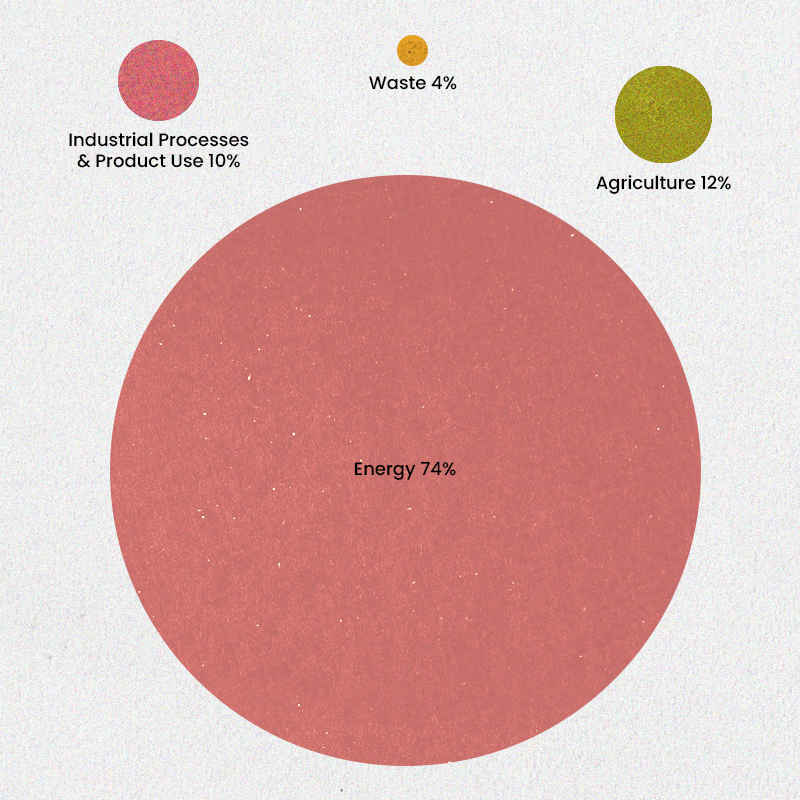
In 2021, the energy sector was responsible for 74% of total annual global greenhouse gas emission.
This was followed by the Agricultural Sector, the Industrial Processes & Product Use, and Waste.
In the order of largest to smaller, the sectors are :
Energy (74%)
Majority of the energy sector emissions come from energy-related emissions in industry, transport and energy-related emissions in buildings. The other sources include unallocated fuel consumption, fugitive emissions from energy production and energy in agriculture and fishing.
Agriculture (12%)
Majority of the agriculture sector emissions come from livestock and manure, agricultural soil and crop burning. The other sources include deforestation, rice cultivation, cropland, grassland.
Industrial Processes and Product Use (10%)
Industrial Processes and Product Use include direct emissions from industrial manufacturing process of cement and chemicals.
Waste (4%)
Emissions from the waste sector include decomposition of organic matter in landfills and wastewater
--
Cutting across all sector categories, electricity and heat production are the largest contributor to global emissions. This is followed by transport, manufacturing and construction (largely cement and similar materials), and agriculture .
Greenhouse gases, largest 'annual' country emissions
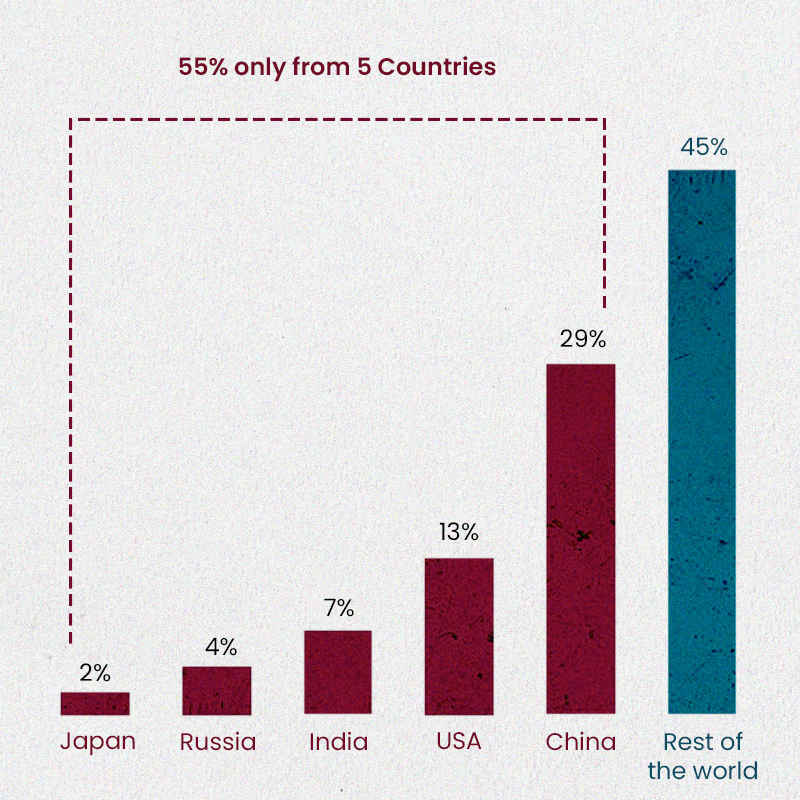
In 2021, the five most-greenhouse-gas-emitting countries together contributed 56% of global emission with 48.612 Giga-tonnes.
These countries were :
- China (29%)
- United States of America (13%)
- India (7%)
- Russia (4%)
- Japan (2%)
United States of America (USA) had been releasing the largest quantity of greenhouse gas each year since 1850, until in 2005 when China took over.
India first joined the top-5 most greenhouse gas emitting country club in 1991. It has held the third most emitting country position since 2008.
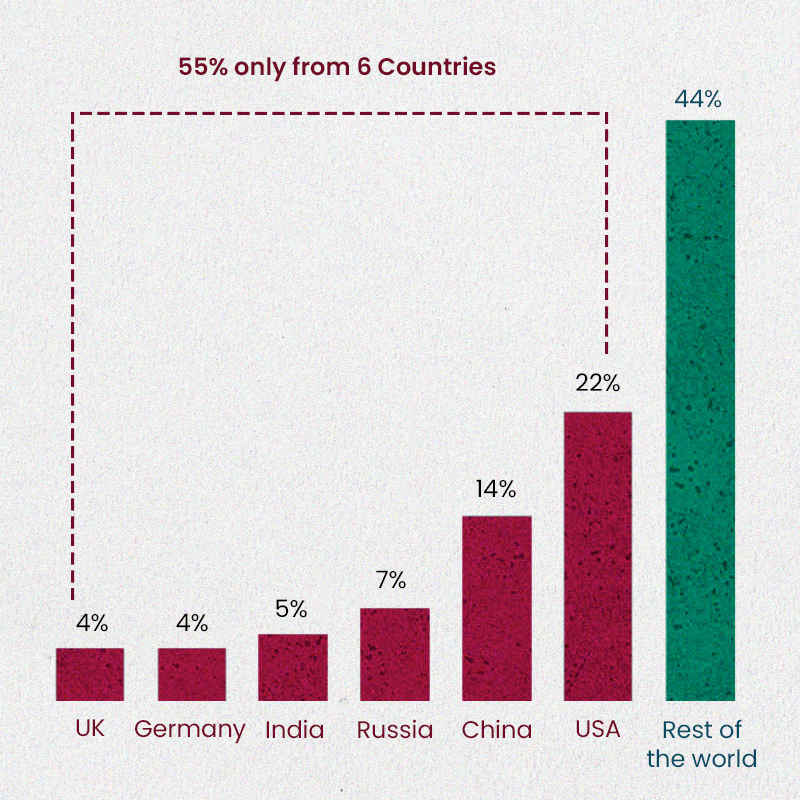
Greenhouse gases, largest 'cumulative' country emissions
Since record-keeping began in 1850, the countries responsible for releasing the largest quantity of greenhouse gases into out atmosphere are :
- United States of America (22%)
- China (14%)
- Russia (7%)
- India (5%)
- Germany (4%), closely followed by United Kingdom (4%)
--
It is worth noting, that this difference between those that are responsible for the largest emission historically vs those responsible for the largest present day emission annually - has tipped several climate negotiation, complicated over the years.
We use cookies to personalise your content, and provide a better experience. By using our platform and services, you agree to our use of cookies as described in our cookie policy.